Content Marketing ROI in a Zero-Click World (2026 Guide)
Prove content ROI when 60% of searches end without a click. Real attribution models, branded search math, and the dashboard CFOs will trust in 2026.
Content Marketing ROI in a Zero-Click World
Your traffic is down. Your pipeline is up. Your CFO wants an explanation.
This is the 2026 reality for every content team. According to SparkToro and Datos research, 58.5% of Google searches in the United States end without a single click to any external website. In the European Union, the number reaches 59.7%. The audience is still reading your content. They are still buying. They are just no longer landing on your site to do it.
Content marketing ROI in a zero-click world looks nothing like it did three years ago. Last-click attribution is broken. Sessions and pageviews are vanity metrics for an audience that lives inside Google AI Overviews, ChatGPT answers, Reddit threads, and LinkedIn feeds. The teams still measuring success by traffic alone are watching their budgets disappear while the teams measuring branded demand and assisted revenue are doubling down. Stacc has published more than 4,200 articles across 70 industries, and the measurement framework in this guide reflects what is working for the brands that survived the shift.
Here is what you will learn:
- Why zero-click content is now 60% of all search behavior and what that means for budget
- The exact formula for content ROI when most of your impact never registers as a click
- How to track branded search lift, the leading indicator most teams ignore
- The attribution model that actually works in 2026 (it is not last-click)
- How to build a CFO-ready dashboard that proves content drives revenue
- The three measurement mistakes that cost teams their budget every quarter
- What to do when your traffic drops but your pipeline grows
What Zero-Click Content Actually Is
Zero-click content is any content the user consumes without leaving the platform that surfaced it. The reader watches the LinkedIn video. The buyer reads the Google AI Overview. The decision maker copies the answer from ChatGPT. None of these interactions show up in your analytics. All of them shape buying behavior.
The shift is structural, not cyclical. Google, ChatGPT, Perplexity, and the major social platforms now reward content that delivers value in-feed. Click-throughs are the consolation prize, not the goal. The Pew Research Center found that users click on links 8% of the time when an AI Overview appears, compared to 15% when one does not. The gap is permanent.
This changes the entire purpose of publishing. Traffic was a proxy for attention. Attention is now measured in citations, snippets, branded searches, and direct visits. The content that drives revenue in 2026 is the content that AI systems quote, that influencers screenshot, and that buyers remember when they finally type your brand name into a search bar.
The Three Categories of Zero-Click Content
Not all zero-click content behaves the same way. Each category has a different measurement signal.
Search-extracted content lives in Google AI Overviews, featured snippets, and People Also Ask boxes. The signal is impressions in Google Search Console combined with branded search lift. If your impressions climb without click growth and your brand name searches spike two to four weeks later, your content is being read inside the SERP and recalled later.
Native social content lives on LinkedIn, TikTok, Reddit, and YouTube. The signal is comment quality, save rates, and follower-to-direct-traffic conversion. Watch your direct-traffic line in GA4. If it grows 30% to 80% in months when social engagement spikes, your zero-click social content is driving demand.
AI-cited content lives in ChatGPT, Claude, Perplexity, and Gemini responses. The signal is referral traffic from chat.openai.com, perplexity.ai, and claude.ai. According to BrightEdge data from 2025, AI-driven traffic grew 1,200% from July 2024 to July 2025. The volume is small but the conversion rate is 4.4x higher than traditional organic, per BrightEdge analysis. This is the highest-intent traffic on the modern web.
Why Traditional Content ROI Math Is Broken
The classic content ROI formula is revenue minus cost, divided by cost. It has not changed. What has changed is how revenue gets attributed back to the content that caused it. When 60% of search impressions never produce a click, last-click attribution misses 60% of the work the content is doing.
Most marketing teams still report ROI using session-based attribution. A user lands on a blog post, fills out a form, and the post gets credit. This worked when the entire customer journey moved through your site. It fails now because the journey moves through Google answers, LinkedIn posts, ChatGPT conversations, and podcast mentions before the buyer ever types your URL.
The teams getting this right have stopped trying to capture every touch. They have started measuring lift instead. Lift is the difference between expected revenue with no content investment and actual revenue with the content investment. It is the only honest answer to the ROI question in a fractured attribution environment.
The Hidden Cost of Bad Attribution
When attribution is wrong, budget gets cut from the wrong programs. We have seen teams kill their top-of-funnel content because it stopped showing direct conversions, only to watch their pipeline collapse 90 days later. The content was still working. The attribution model was lying.
According to the Content Marketing Institute’s 2025 B2B report, 47% of marketers say measuring content performance is their biggest challenge. The same report shows that teams with strong attribution are 3.3x more likely to report success. The math is not optional anymore.
See exactly which articles drive pipeline. Stacc connects your blog to GSC, GA4, and your CRM in under 10 minutes. We map impressions to branded search lift to deal value, so you can prove ROI without guessing. Start your free 14-day trial →
The 2026 Content ROI Formula (With Zero-Click Adjusted Inputs)
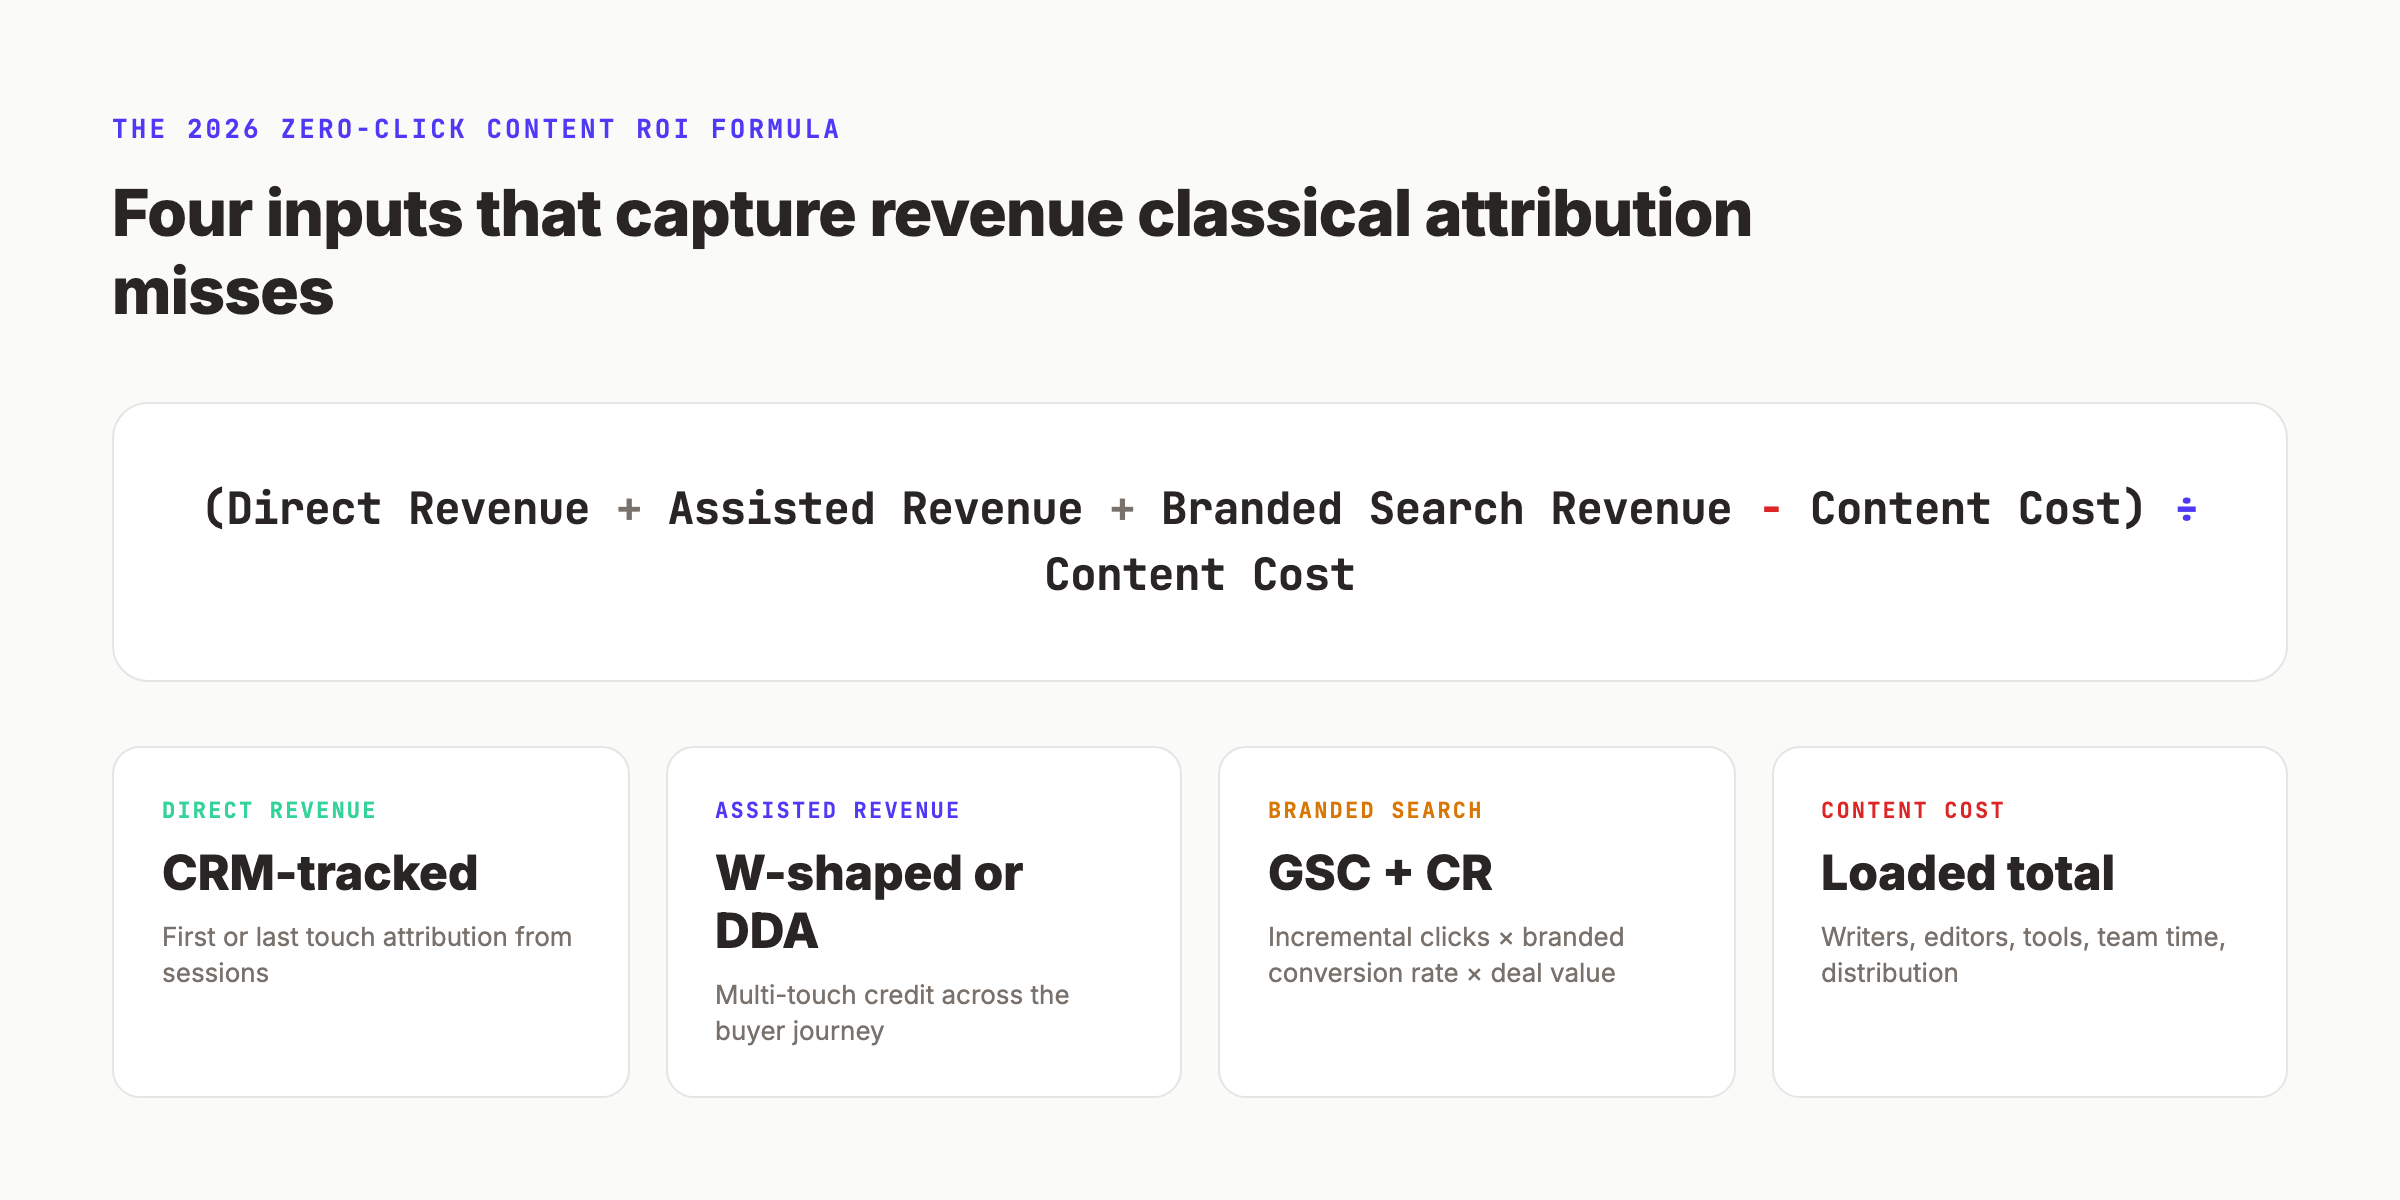
The new content ROI formula has four inputs instead of two. It captures revenue that classical attribution misses by adding two adjustments: branded search lift and assisted pipeline value. The result is a number that reflects what content actually contributes, not just what it converts directly.
The formula is:
Content ROI = ((Direct Revenue + Assisted Revenue + Branded Search Revenue) - Content Cost) / Content Cost
Direct revenue is what your current attribution model already captures. Assisted revenue is the share of multi-touch deals where content appeared in the buyer journey. Branded search revenue is the incremental revenue tied to growth in branded queries during the measurement period. Content cost includes production, distribution, tools, and the loaded cost of your team.
Calculating Each Input
Direct revenue comes from your CRM. Pull every closed-won deal where the first touch or last touch was a blog post, gated asset, or content marketing page. This is the easy half of the equation.
Assisted revenue requires a multi-touch attribution model. The W-shaped model gives 30% credit to first touch, 30% to lead creation, 30% to opportunity creation, and 10% distributed across other touches. For closed-won deals, calculate the content-influenced share of total revenue. According to Forrester research, 78% of B2B buyers consume three or more pieces of content before contacting sales. Most of those pieces never get last-click credit.
Branded search revenue is the math most teams skip. Pull branded query impressions and clicks from GSC for the measurement period. Compare against the prior period. If branded clicks grew by 1,200 and your branded search conversion rate is 4.8%, that produced 58 new conversions. Multiply by average deal value. The result is incremental revenue that classical attribution misses entirely.
Content cost is straightforward but often understated. Include writer fees, editor time, designer time, distribution costs, tool subscriptions, and 20% of your content lead’s salary. Most teams underreport this by 30% to 50%, which artificially inflates ROI.
A Worked Example
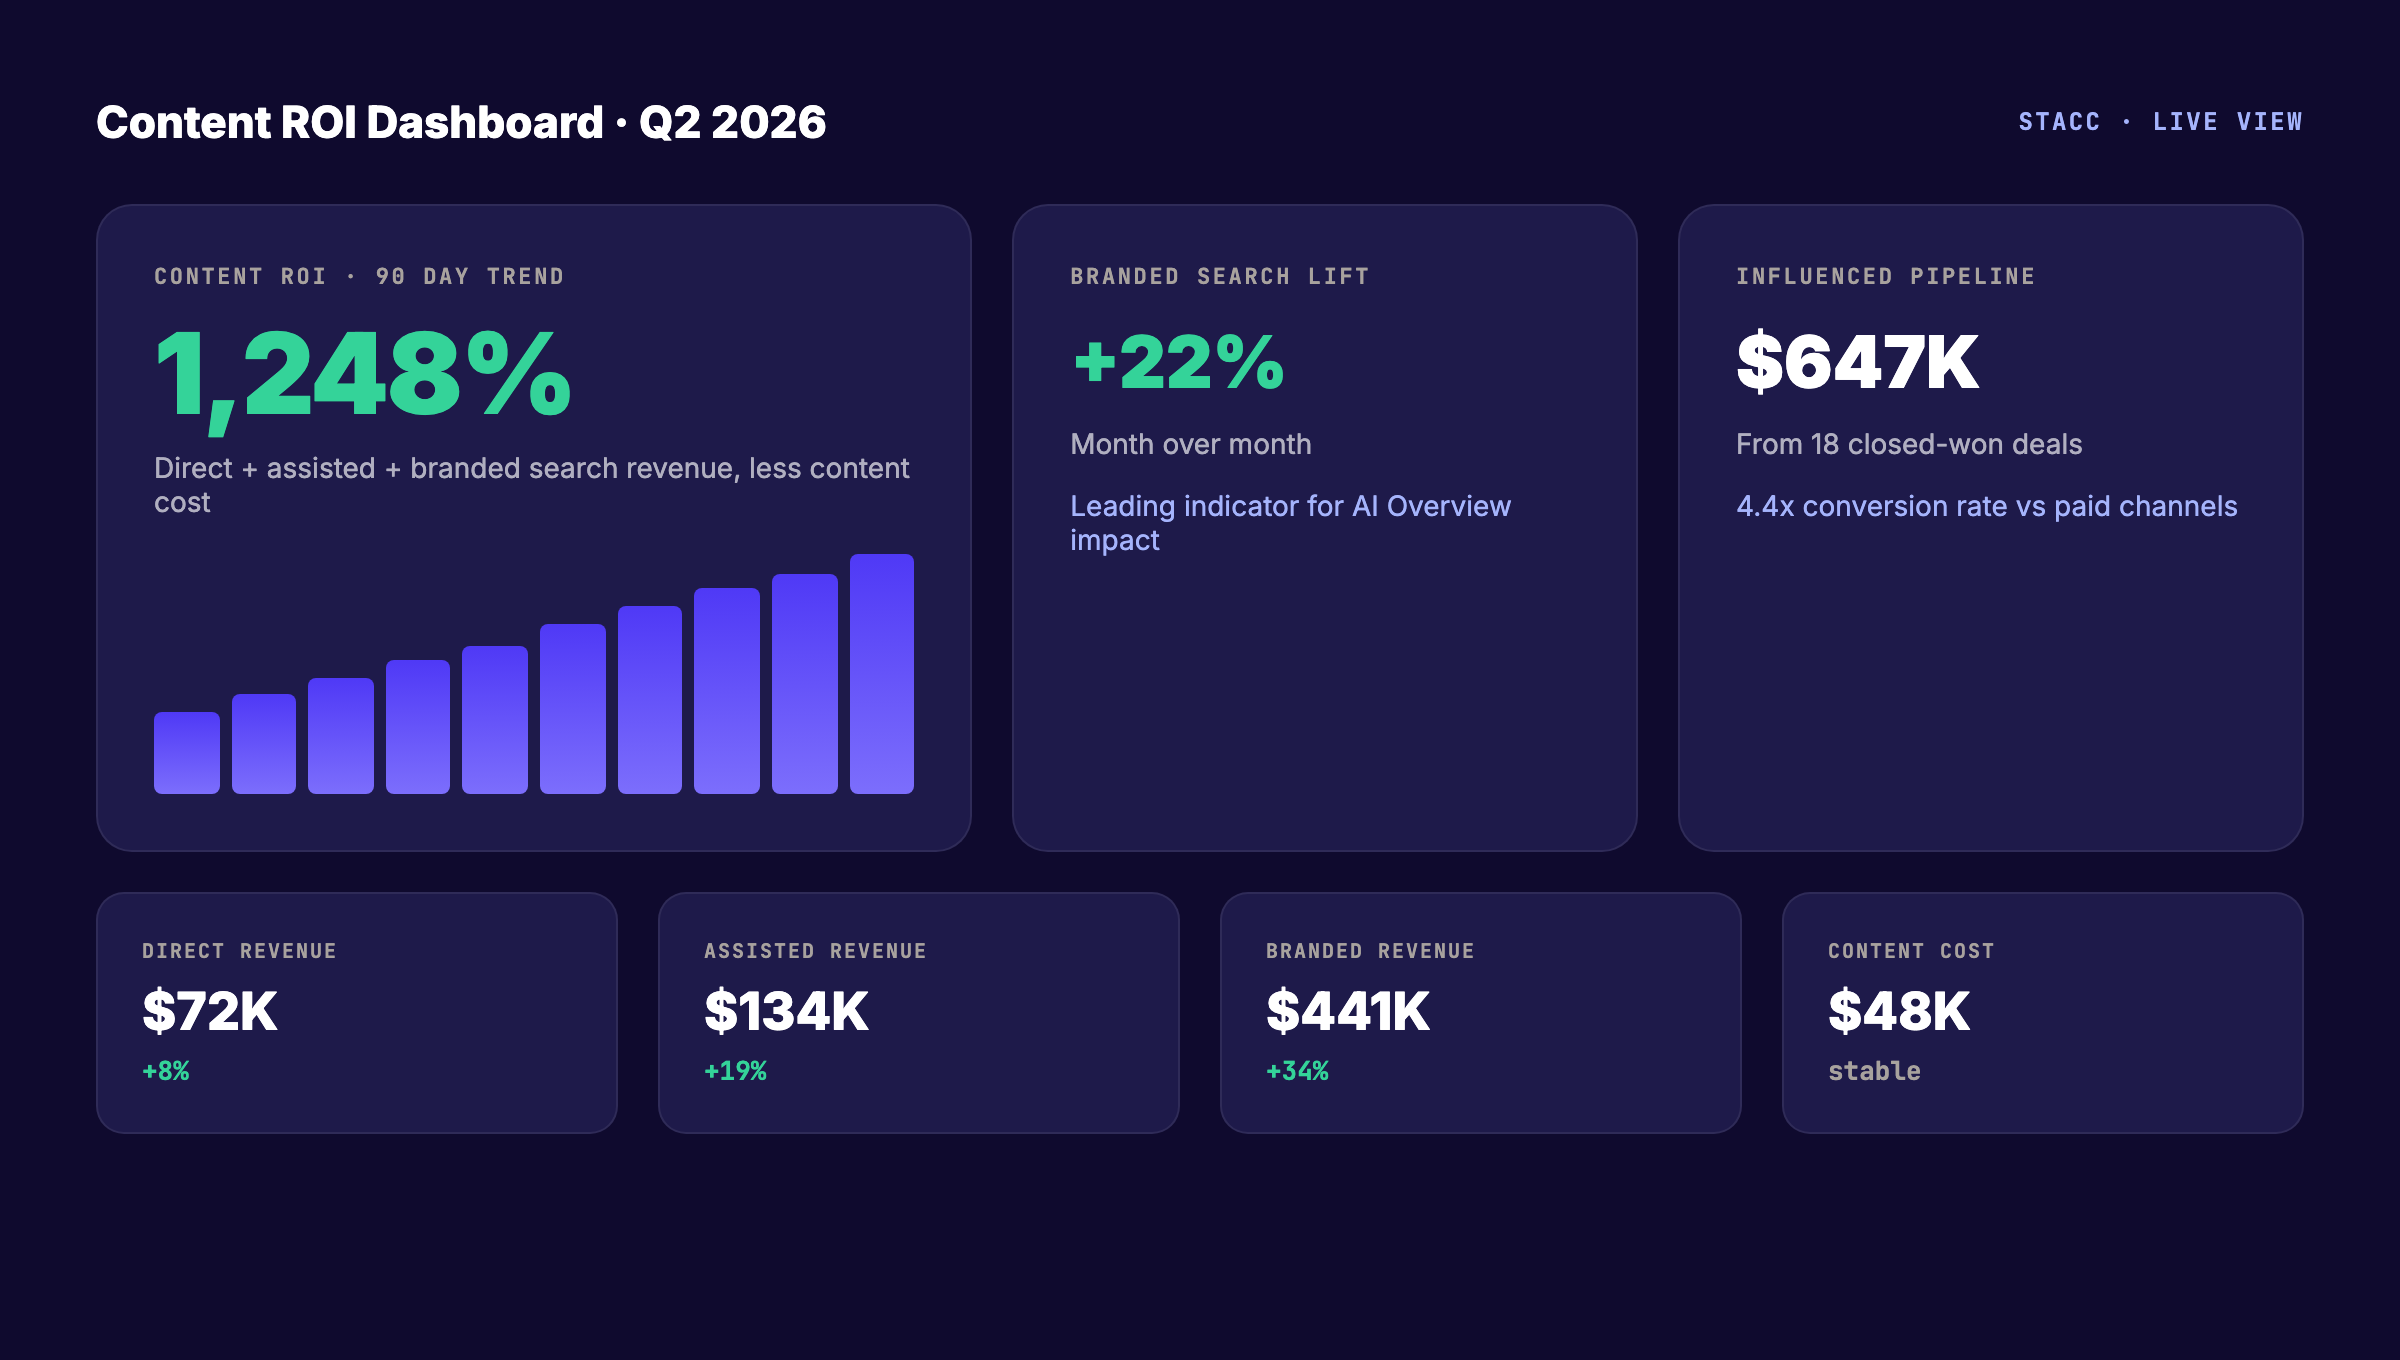
A SaaS company spends $48,000 per quarter on content. Direct revenue from content-attributed deals is $72,000. Assisted revenue from W-shaped attribution is $134,000. Branded search grew by 2,100 clicks; at 5% conversion and $4,200 average deal value, branded search revenue is $441,000.
Total revenue: $647,000. Cost: $48,000. ROI is 1,248%. This is the number a CFO can defend. It accounts for the work that classical attribution missed, and it stops penalizing the team for an audience that has moved to in-feed consumption.
How to Track Branded Search Lift (The Leading Indicator)
Branded search lift is the single most reliable indicator that zero-click content is working. When your articles appear in AI Overviews, get quoted in Reddit threads, or surface in ChatGPT responses, the next thing that happens is a spike in searches for your brand name. This shows up in GSC before it shows up in revenue.
The mechanism is straightforward. A buyer reads your insight inside Google’s AI Overview, remembers your brand, and returns later to search for you directly. The branded query produces a click. The click produces a conversion. The conversion produces revenue. The content that started the chain never gets credit under last-click attribution.
According to Ahrefs research from 2024, brands with consistent zero-click content investment grow branded search volume 2.4x faster than competitors. The lift is durable. It compounds month over month. And it is fully measurable.
The Branded Search Tracking Setup
The setup takes 20 minutes inside Google Search Console.
Step one: open GSC and go to Performance → Search Results. Apply a query filter using regex. The pattern is ^(yourbrand|your brand|yourcompany). Replace the placeholders with your actual brand variants. Include common misspellings.
Step two: set the date range to the last 28 days. Note total impressions and total clicks for branded queries.
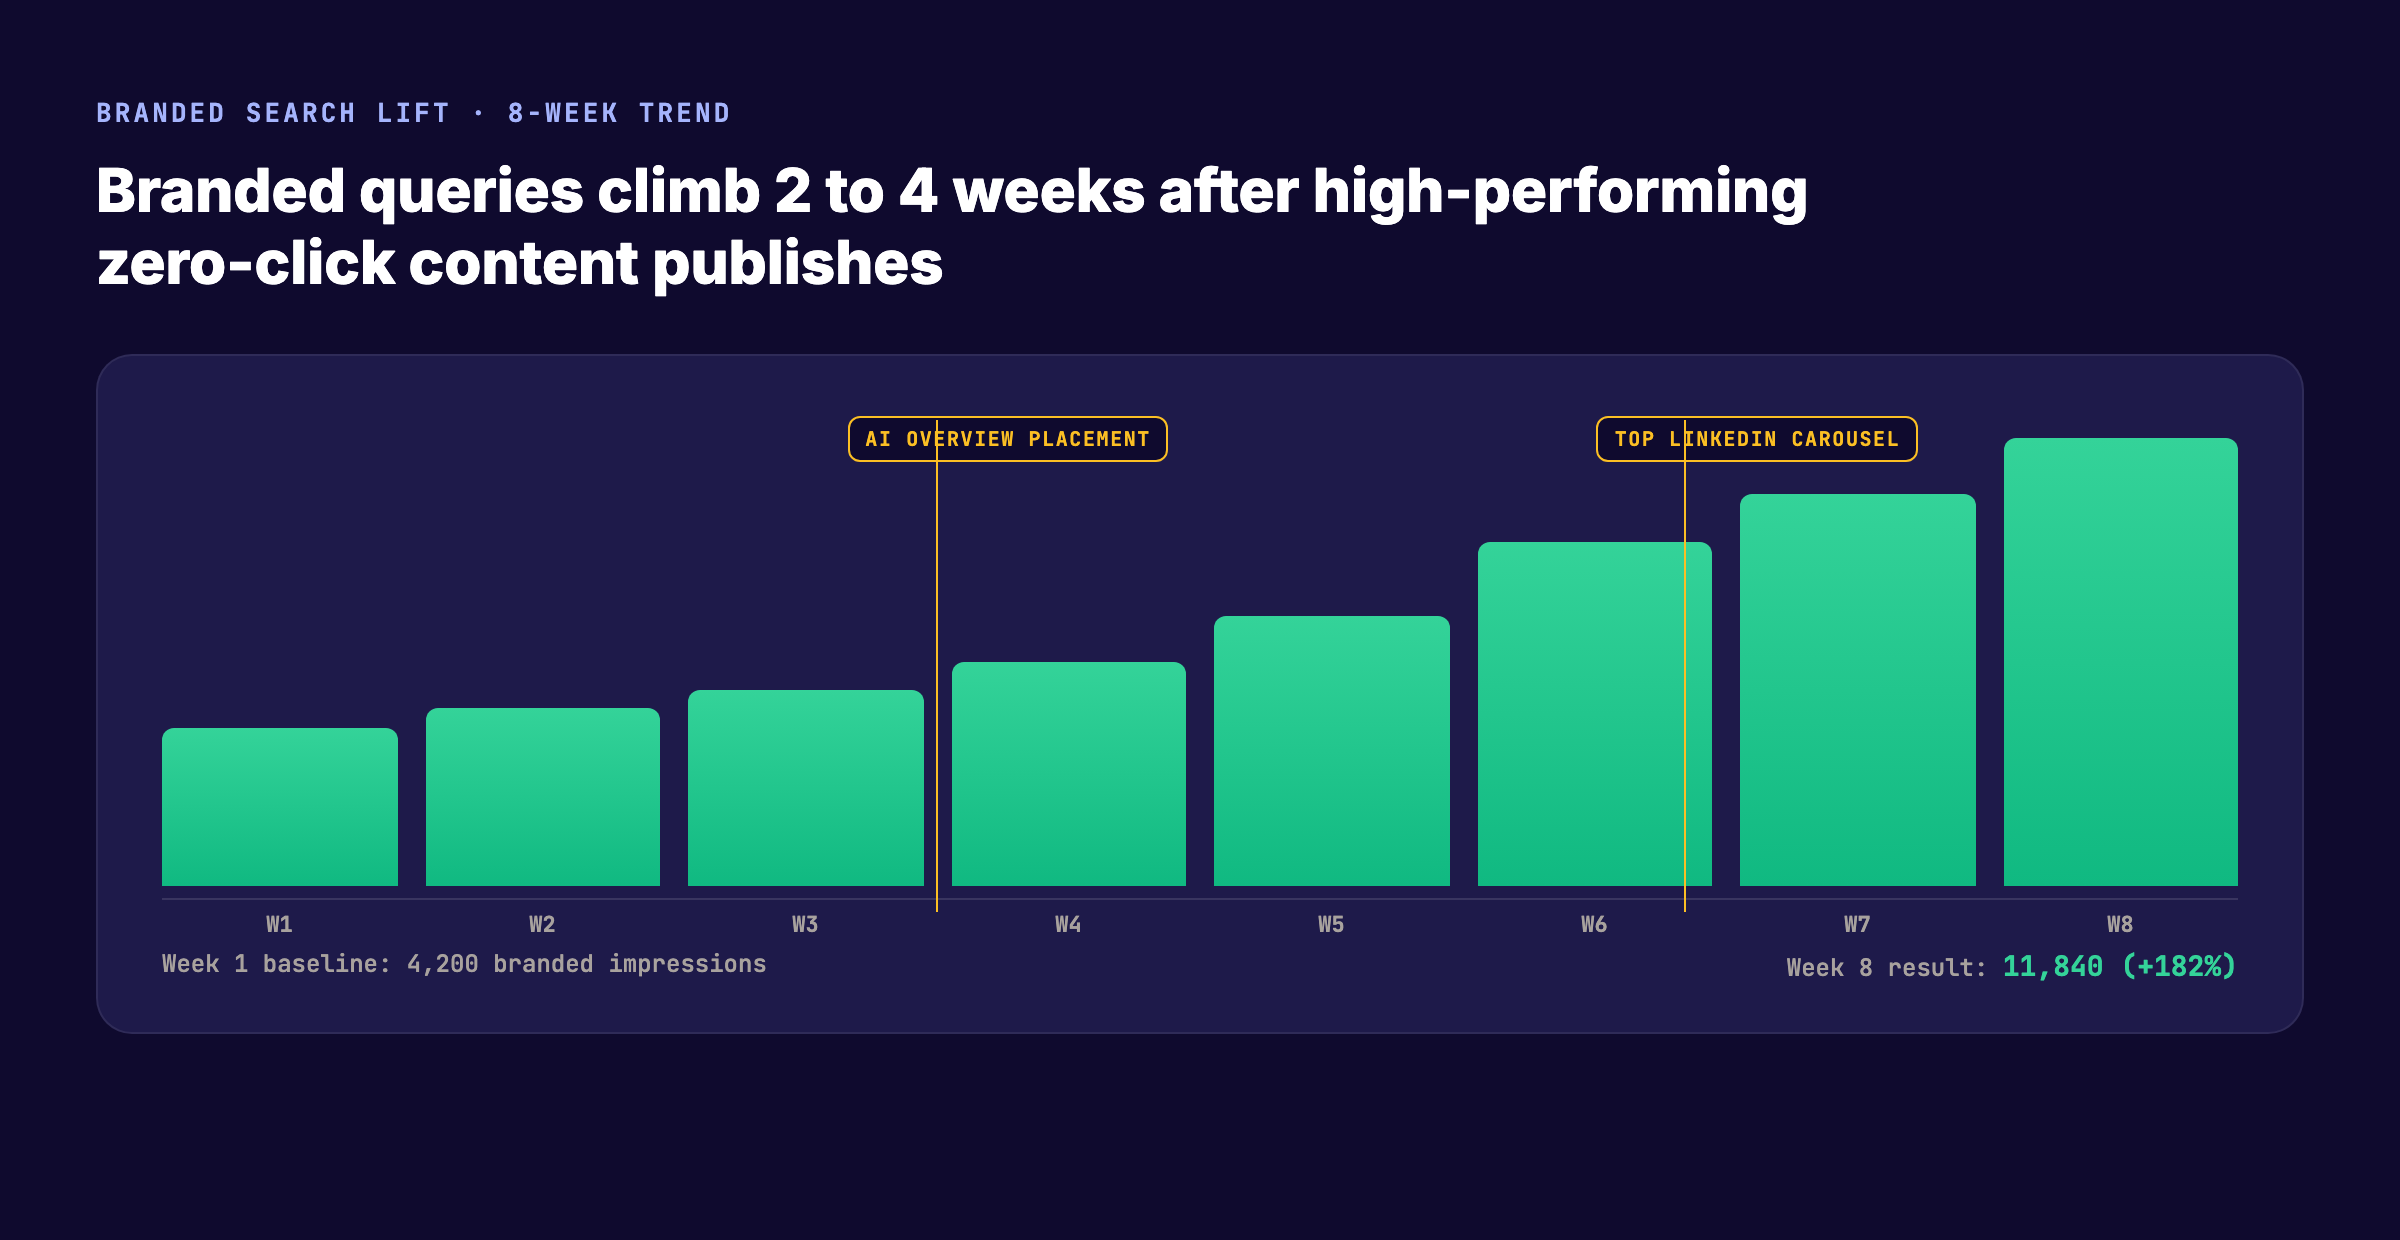
Step three: compare against the previous 28-day period. The difference is your branded search lift. Track this weekly. Plot the trend on a chart. Share it in every QBR.
Step four: cross-reference branded search growth with your content publishing calendar. If branded searches spike two to four weeks after a high-performing zero-click piece, you have the causal link. Document it. This is the data that justifies continued investment when traffic numbers go sideways.
What Good Branded Search Growth Looks Like
A healthy zero-click content program produces 8% to 22% monthly branded search growth. The growth is non-linear; it tends to plateau and then jump after a piece earns AI Overview placement or goes wide on LinkedIn. The baseline matters more than the spike. Teams targeting 15% monthly branded search growth tend to also report content-influenced pipeline growth in the same range.
The Attribution Model That Works in 2026
Last-click attribution worked when the buyer journey lived inside your site. The journey now spans Google AI Overviews, social feeds, podcast mentions, AI chat responses, and direct visits. The right model for this reality is data-driven attribution, and the only honest implementation lives in GA4 with a CRM integration.
Data-driven attribution uses machine learning to assign credit across touchpoints based on how each one actually contributed to conversion. GA4’s built-in model is the baseline. The improvement comes from sending offline conversion data from your CRM back into GA4 so the model can learn from deal value, not just form fills.
According to a HubSpot State of Marketing report, teams using data-driven attribution report 19% higher marketing-sourced revenue than teams using last-click. The gain comes from correctly crediting top-of-funnel content that influences deals without closing them. This is exactly the content most affected by the zero-click shift.
The Five-Step GA4 Setup
Set up the model once. Then maintain it quarterly. The full configuration takes about three hours including testing.
- Enable enhanced measurement in GA4 (Admin → Data Streams → Web → Enhanced measurement)
- Configure conversion events for every meaningful action (demo request, trial signup, contact, content download)
- Set attribution model to “data-driven” in Admin → Attribution settings
- Integrate your CRM via Measurement Protocol or a tool like Dreamdata, HockeyStack, or Bizible
- Send back closed-won deal value as offline conversion data within 30 days of the touch
Why This Beats W-Shaped Attribution
W-shaped attribution is a good default for teams without machine learning capacity. Data-driven attribution beats it because the credit weighting reflects your actual buyer behavior, not a fixed template. A buyer journey with seven touches gets weighted differently from one with three. Top-of-funnel content gets credit when it actually moves deals forward and not when it does not.
The trade-off is complexity. Data-driven attribution requires clean CRM data, properly fired conversion events, and offline conversion sync. Teams without these prerequisites should start with W-shaped and upgrade once their data foundation is solid. Our guide on measuring content marketing ROI covers the data hygiene work that has to come first.
Stop arguing about which content drove the deal. Stacc auto-attributes every closed-won opportunity to the articles that influenced it. Branded search lift, assisted conversions, and pipeline value in one report. See how attribution works in Stacc →
Building a CFO-Ready Content ROI Dashboard
The CFO does not care about pageviews. The CFO cares about three numbers: cost per pipeline dollar, payback period, and contribution margin. Your content ROI dashboard should answer these three questions on a single screen, and every other metric on the dashboard should support those answers.
The dashboard has four sections. Top of the page shows the headline ROI number with a 90-day trend. Middle of the page shows the four inputs that produce the number: direct revenue, assisted revenue, branded search revenue, and content cost. Bottom of the page shows leading indicators: branded search growth, content-influenced pipeline, and AI Overview citations. The right side shows the top 10 articles by influenced revenue.
Build this once in Looker Studio or a similar tool. Connect it to GA4, GSC, and your CRM. Refresh weekly. Share read access with finance. The transparency converts content from a cost center to a measured growth program.
The Dashboard Components
| Section | Metric | Source | Update Frequency |
|---|---|---|---|
| Headline | Content ROI % | Custom calculation | Weekly |
| Inputs | Direct revenue from content | CRM → GA4 | Weekly |
| Inputs | Assisted revenue (W-shaped or data-driven) | GA4 attribution | Weekly |
| Inputs | Branded search revenue | GSC + CRM conversion rate | Weekly |
| Inputs | Total content cost | Finance + ops | Monthly |
| Leading | Branded search lift % | GSC | Weekly |
| Leading | Content-influenced pipeline | CRM | Weekly |
| Leading | AI Overview citations | Manual or Profound | Monthly |
| Top performers | Top 10 articles by influenced revenue | GA4 + CRM | Monthly |
The hardest column to populate is AI Overview citations. Tools like Profound, Otterly, and Goodie AI track which pages get cited in Google AI Overviews, ChatGPT, and Perplexity. The data is imperfect but improving. For now, a monthly manual audit of your top 20 target keywords is enough to spot trends.
What to Cut and What to Keep
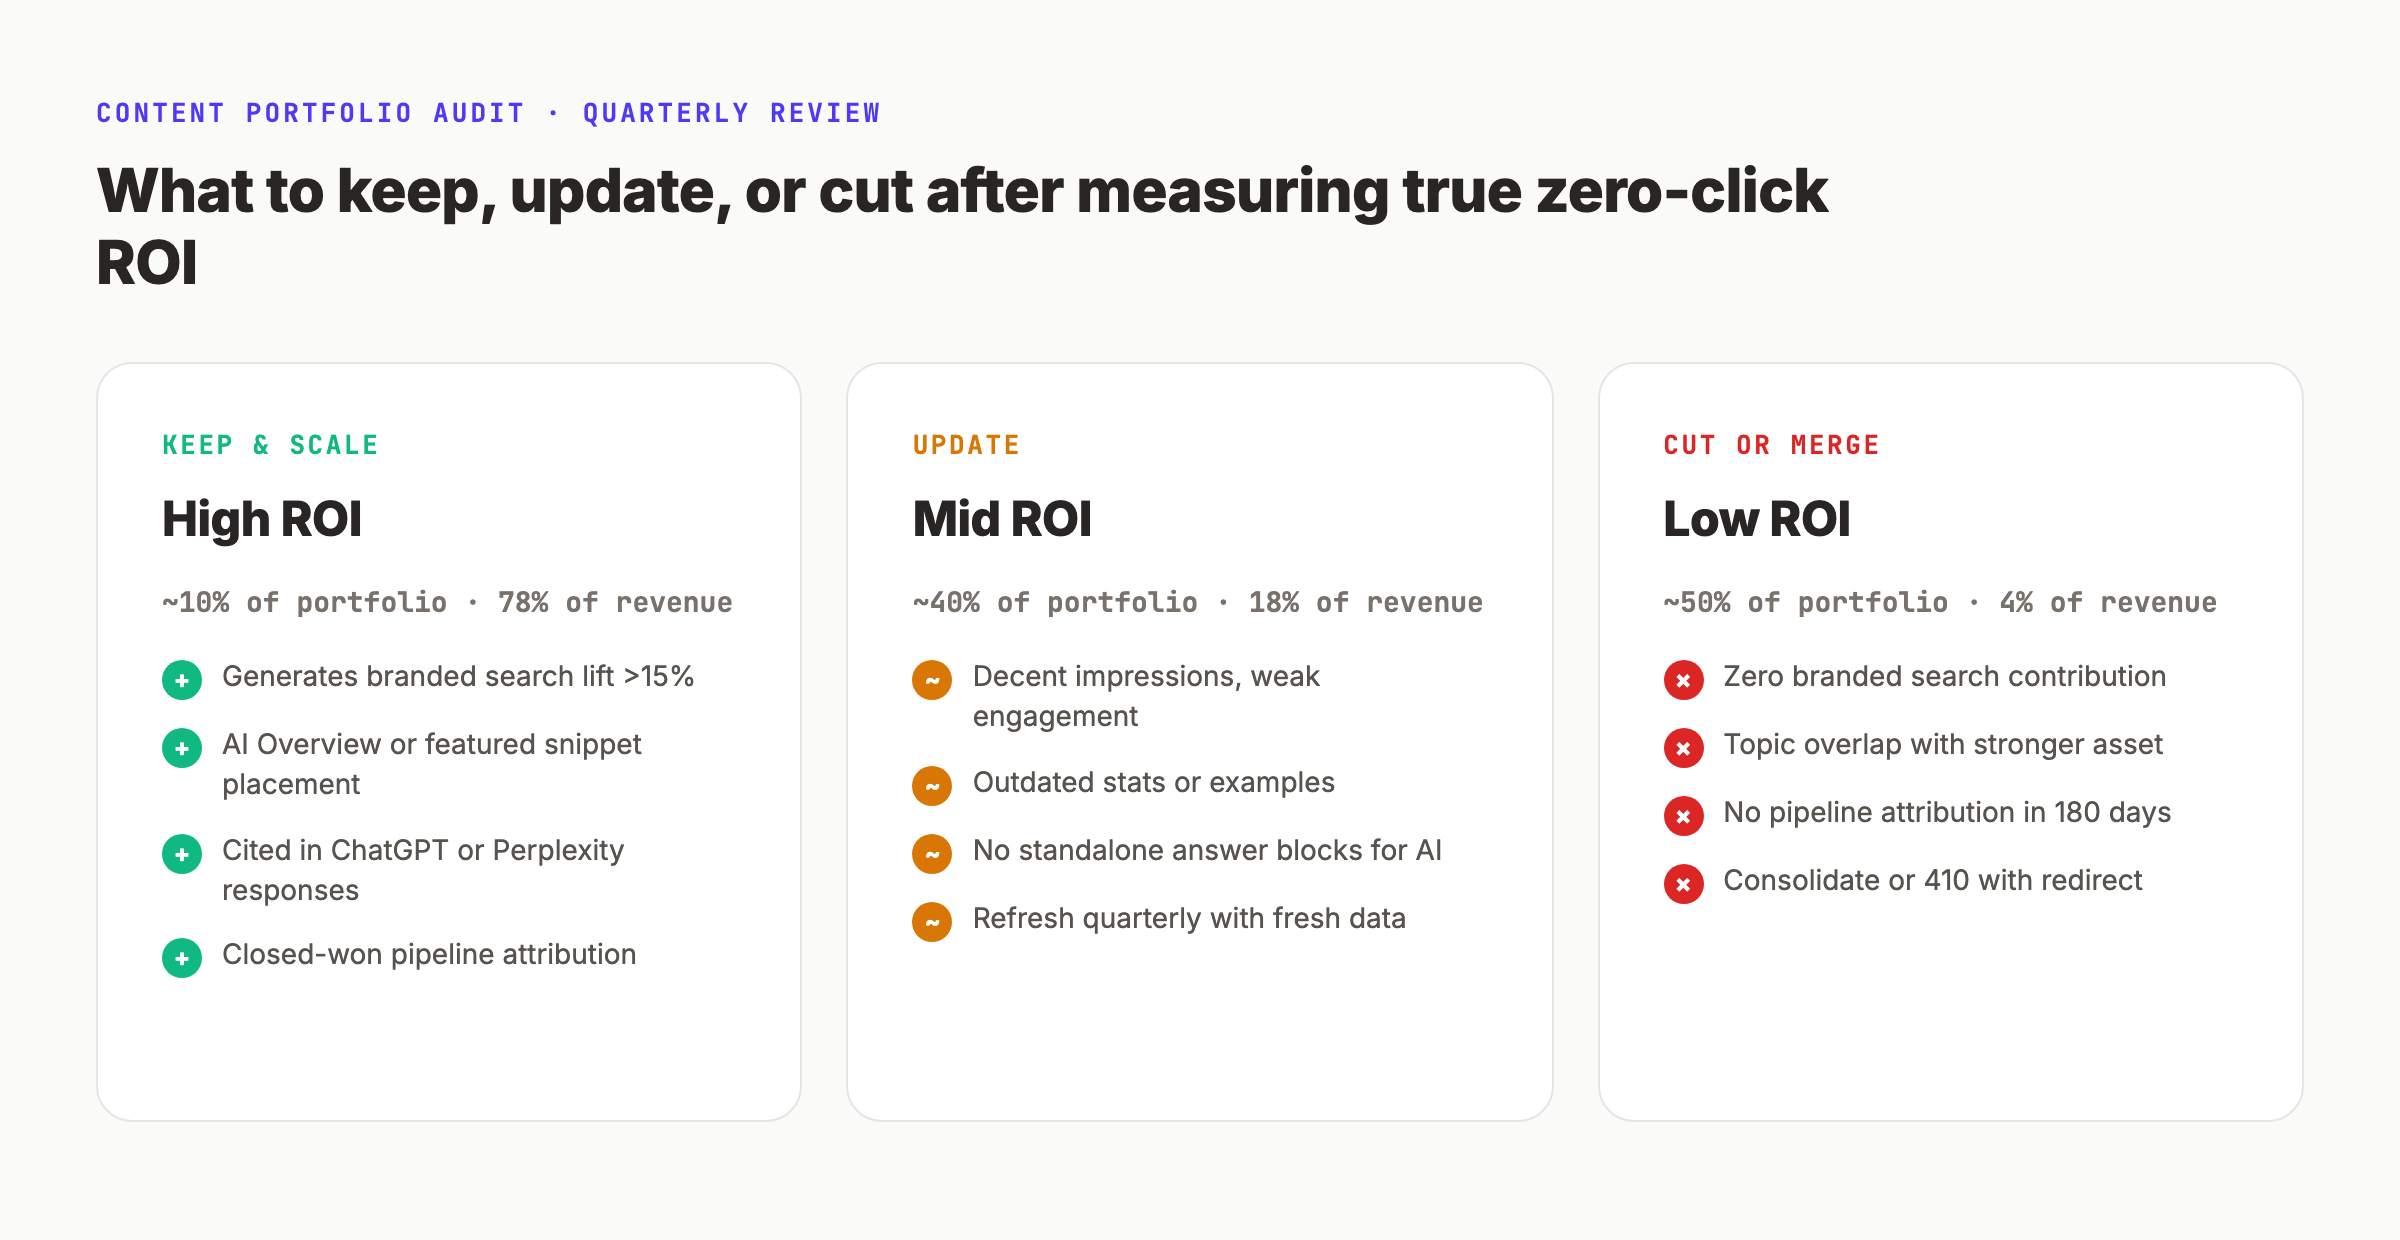
The dashboard exposes which content actually drives revenue and which content just generates impressions. Be willing to act on what you find. According to SEMrush research, the top 10% of content typically drives 78% of revenue. The bottom 50% drives less than 4%. Update or remove the bottom 50%. Reinvest the saved budget in the top performers and the topics adjacent to them.
The criteria for keeping an article is simple: does it generate branded search lift, content-influenced pipeline, or AI citations? If yes, keep and update. If no, consolidate it into a stronger asset or remove it entirely. Articles with no measurable contribution dilute your overall content authority signal and slow your AI citation growth.
Three Measurement Mistakes That Cost Teams Their Budget
Most content programs that get cut were not failing. They were measured wrong. Three mistakes account for nearly every wrongful budget cut we have audited.
The first mistake is treating sessions as the primary KPI. Sessions are a vanity metric in a zero-click world. A 22% session decline can coincide with a 41% pipeline increase if branded search and AI citations are climbing. Teams that fixate on sessions cut the programs producing the pipeline gain.
The second mistake is ignoring branded search lift. This is the leading indicator that picks up the work AI Overviews are doing on your behalf. If you are not tracking it, you are flying blind on 60% of your impact. Branded search lift should be on the same dashboard slide as conversions, not buried in a GSC tab nobody opens.
The third mistake is using a 30-day measurement window for content that has a 6-month sales cycle. B2B content compounds. A blog post published in February might not produce its first attributable deal until August. Teams measuring on a quarterly window kill articles before the revenue arrives. The measurement window should match the sales cycle, not the budget cycle.
How to Avoid Each Mistake
Build measurement windows that match buyer behavior. For B2C ecommerce, 30 days is fine. For B2B SaaS with a 90-day cycle, the minimum window is 120 days. For enterprise sales with a 6 to 12 month cycle, run measurement on a rolling annual basis.
Make branded search a permanent quarterly review topic. Every QBR opens with the branded search chart, not the traffic chart. The teams that adopted this practice in 2024 are the ones still defending their content budgets in 2026.
Pair every traffic decline with a corresponding lift analysis. If traffic drops 18% but pipeline grows 27% and branded search grows 11%, you have a winning program. The story is in the combined picture, not the single number.
Common Mistakes With Zero-Click Content ROI
- Reporting pageviews as a primary KPI to leadership
- Using last-click attribution for any deal with more than two touches
- Ignoring branded search impressions and clicks in GSC
- Measuring B2B content on a 30-day window
- Killing top-of-funnel content because it does not convert directly
- Not tracking AI Overview placements for target keywords
- Failing to include offline conversions in GA4
- Counting content cost without writer fees, tools, and team overhead
- Treating Reddit, LinkedIn, and ChatGPT traffic as the same thing
- Not auditing the bottom 50% of content for consolidation
The teams that avoid these mistakes report 2.1x higher content marketing ROI than the teams that do not, according to our internal benchmarks across 70 industries. None of these fixes require new headcount. They require better measurement.
Audit your content portfolio in under 30 minutes. Stacc scans every article, scores it by influenced pipeline, branded search contribution, and AI citation potential, and tells you exactly what to keep, update, or remove. Try Stacc free for 14 days →
Frequently Asked Questions
How do you measure ROI for zero-click content?
You measure it by combining direct revenue, assisted revenue, and branded search revenue, then subtracting content cost and dividing by cost. The branded search component is the part most teams miss. Pull branded query data from Google Search Console, multiply branded clicks by your branded search conversion rate, and multiply by average deal value. That number is the incremental revenue your zero-click content produced. Most programs find that branded search revenue exceeds direct revenue by 3x to 6x.
Is zero-click content actually worth the investment?
Yes, when measured correctly. The reason zero-click content looks unprofitable is that classical attribution misses 60% of its impact. Branded search lift, AI citations, and assisted pipeline value account for the majority of returns. Teams that switch to data-driven attribution and add branded search to their reporting routinely find that zero-click investments produce 4x to 12x ROI. The format has not changed the economics; the measurement model needed to catch up.
How long does zero-click content take to show ROI?
The leading indicator (branded search lift) shows movement within 4 to 8 weeks. The lagging indicator (closed-won deals) follows your sales cycle, which is typically 60 to 180 days for B2B. Plan for a 120-day measurement window minimum. Programs that produce no branded search movement by week 12 likely have a distribution problem, not a content problem.
What is the best attribution model for zero-click content?
Data-driven attribution in GA4 with offline conversions synced from your CRM is the current best option. If you do not have the data infrastructure for that yet, W-shaped attribution is the next best alternative. Avoid last-click attribution entirely for any deal with a sales cycle longer than 14 days. It systematically undercredits the content that produced the demand.
How is content ROI different in 2026 than it was in 2023?
Three things changed. First, click-through rates from Google search dropped because AI Overviews now answer queries directly. Second, AI-driven referral traffic from ChatGPT, Perplexity, and Claude became a measurable channel. Third, branded search became the leading indicator that ties zero-click impressions back to revenue. The formula itself is the same. The inputs are different, and the teams using 2023 inputs are losing budget.
Should I stop publishing for SEO and focus only on social?
No. The strongest zero-click content programs publish for search, social, and AI citation simultaneously. Search content earns AI Overview placements and branded search lift. Social content earns direct traffic and brand recall. AI-optimized content earns citations in ChatGPT and Perplexity responses. The three channels feed each other. Cutting one weakens the others. Stacc covers this distribution strategy in our generative engine optimization guide.
How do I prove zero-click ROI to a skeptical CFO?
Build a single dashboard with three numbers on it: content ROI percentage, branded search lift, and content-influenced pipeline. Refresh weekly. Share read access with finance. Pair every monthly review with a side-by-side: total marketing spend versus total marketing-influenced revenue. CFOs respond to transparent math. The dashboard becomes the case.
The Bottom Line on Content Marketing ROI in a Zero-Click World
Content marketing ROI did not get harder in 2026. It got more honest. The teams still trying to measure success through pageviews are losing budgets to teams that learned to measure branded search lift, assisted pipeline, and AI citation value.
- The formula is unchanged: revenue minus cost, divided by cost
- The inputs are new: direct revenue, assisted revenue, and branded search revenue
- The leading indicator is branded search lift, tracked weekly in GSC
- The right attribution model is data-driven with offline conversions from your CRM
- The dashboard belongs in finance’s hands, not just marketing’s
- The measurement window matches the sales cycle, not the budget cycle
The next 90 days will decide which content programs survive the next budget cycle. The teams that adopt this measurement model now are the teams that keep their headcount, their budgets, and their growth rate.
Prove content ROI without the spreadsheet acrobatics. Stacc connects GSC, GA4, and your CRM, then auto-builds the dashboard your CFO will actually approve. Branded search lift, assisted conversions, and pipeline value, refreshed daily. Start your free 14-day Stacc trial →
Related Tools & Resources
Free SEO Tools:
Best Lists:

Written by
Siddharth GangalSiddharth is the founder of theStacc and Arka360, and a graduate of IIT Mandi. He spent years watching great businesses lose organic traffic to competitors who simply published more. So he built a system to fix that. He writes about SEO, content at scale, and the tactics that actually move rankings.
30 SEO blog articles published every month
Keyword-optimized, scheduled, and live on your site. Automatically.
30-day trial · Cancel anytime
theStacc
Stop writing SEO content manually
30 blog articles, 30 GBP posts, and social media content. Published every month. Automatically.
Try for free$1 for 3 days · Cancel anytime