17 SEO Data Reports to Track in 2026 (Complete Guide)
The 17 SEO data reports every team needs in 2026. From GSC performance to AI visibility, track what actually moves rankings and revenue.
17 SEO Data Reports to Track in 2026 (Complete Guide)
SEO without data is guesswork. Yet most teams drown in metrics while starving for insight. Google Search Console, GA4, Ahrefs, and a dozen other tools generate thousands of data points. The problem is not a lack of information. It is knowing which reports to open, what to look for, and how to turn numbers into action.
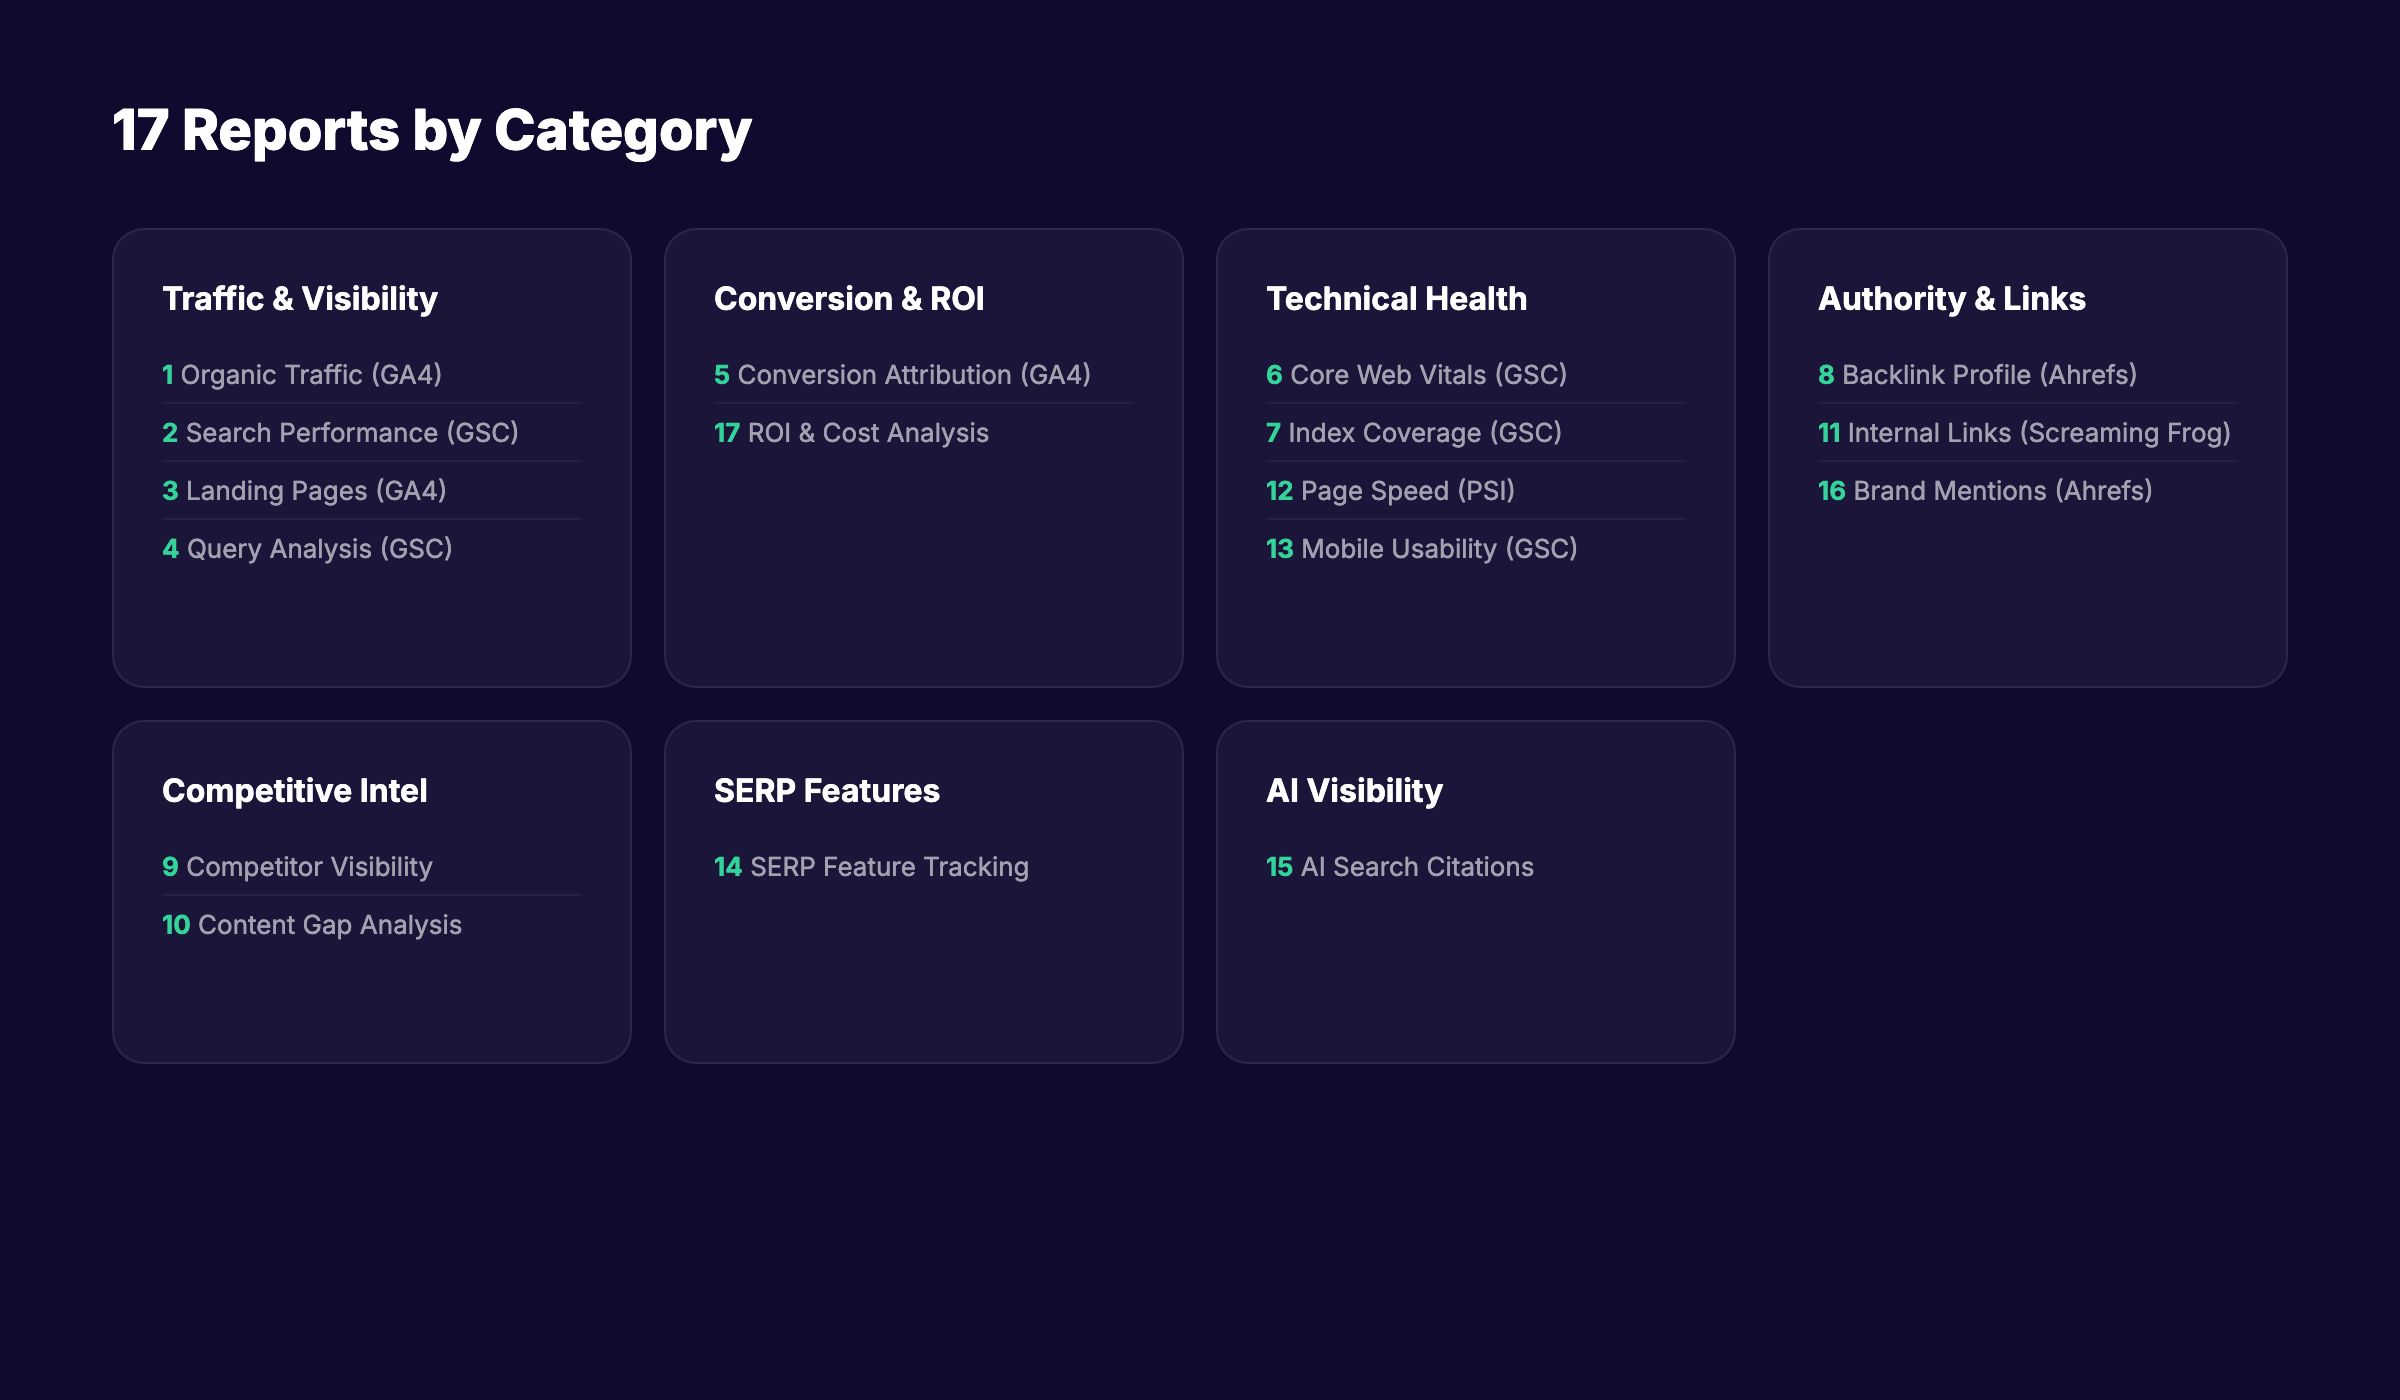
This guide covers the 17 SEO data reports that matter in 2026. These are not vanity metrics. Each report connects to a specific business outcome: rankings, traffic, conversions, or technical health. Stacc’s editorial team uses these exact reports to measure content performance across hundreds of articles. What follows is the distilled list.
Here is what you will learn: the 17 reports organized by function, what each report tells you, how often to review it, the exact metrics to extract, and how to turn each report into a specific action. You will also see how AI visibility reporting has become essential in 2026, and why dashboards with fewer than 12 primary metrics drive 3 times more optimization actions than overloaded ones.
Quick Reference: All 17 Reports at a Glance
| # | Report | Primary Tool | Review Frequency | Business Outcome |
|---|---|---|---|---|
| 1 | Organic Traffic Overview | GA4 | Weekly | Traffic volume and trends |
| 2 | Search Performance | GSC | Weekly | Rankings, CTR, impressions |
| 3 | Landing Page Performance | GA4 | Weekly | Content quality signals |
| 4 | Query Analysis | GSC | Weekly | Keyword opportunity |
| 5 | Conversion Attribution | GA4 | Monthly | Revenue from organic |
| 6 | Core Web Vitals | GSC | Monthly | Page experience health |
| 7 | Index Coverage | GSC | Weekly | Crawl and index status |
| 8 | Backlink Profile | Ahrefs | Monthly | Authority and trust |
| 9 | Competitor Visibility | Ahrefs/Semrush | Monthly | Competitive position |
| 10 | Content Gap Analysis | Ahrefs | Quarterly | New content opportunities |
| 11 | Internal Link Structure | Screaming Frog | Quarterly | Site architecture health |
| 12 | Page Speed Analysis | PageSpeed Insights | Monthly | Performance bottlenecks |
| 13 | Mobile Usability | GSC | Monthly | Mobile experience |
| 14 | SERP Feature Tracking | Semrush | Monthly | Featured snippet ownership |
| 15 | AI Visibility Report | Custom / Profound | Monthly | AI search citations |
| 16 | Brand Mention Monitoring | Ahrefs/Brand24 | Monthly | Reputation and authority |
| 17 | ROI and Cost Analysis | GA4 + Sheets | Quarterly | SEO investment return |
Report 1: Organic Traffic Overview (GA4)
The organic traffic overview is your starting point. It tells you whether your SEO efforts are moving the needle at the highest level. Open GA4, go to Reports, then Acquisition, then Traffic Acquisition. Filter by “Organic Search.”
What to look for: week-over-week and year-over-year trends. A healthy site should show 15-25% year-over-year growth in organic sessions. If growth stalls or declines, the cause is usually in one of three areas: rankings dropped, search demand shifted, or technical issues blocked crawlers.
The metric that matters most is not total sessions. It is the trend direction. A site with 50,000 sessions that grew 20% is healthier than a site with 100,000 sessions that declined 10%. Track the 90-day rolling average to smooth out weekly volatility.
Action step: If organic sessions decline for 3 consecutive weeks, run Reports 2, 6, and 7 immediately to isolate the cause.
Report 2: Search Performance (Google Search Console)
GSC Performance is the most important free SEO tool available. It shows every query that triggered your site in Google, plus impressions, clicks, CTR, and average position. Work through to Performance, then Search Results. Set the date range to 28 days and compare to the previous period.
What to look for: queries with high impressions but low CTR. These are ranking opportunities. A query with 10,000 impressions and a 1% CTR at position 8 could jump to 5% CTR with a move to position 4. That is a 400% click increase without creating new content.
Also track average position changes by page. Pages that dropped 3 or more positions need immediate attention. Pages that gained 3 or more positions are candidates for further optimization to solidify the gain.
CTR benchmarks by position: position 1 averages 28%, position 5 averages 6%, and position 10 averages 2%. If your page ranks at position 3 but CTR is below 4%, your title tag or meta description is underperforming.
Action step: Export the top 50 queries by impressions. Flag any with CTR more than 2 percentage points below the position benchmark. Rewrite those title tags.
Report 3: Landing Page Performance (GA4)
Not all organic traffic is equal. The landing page report reveals which pages attract visitors and, more importantly, which pages engage them. In GA4, go to Reports, Engagement, then Landing Page. Filter by “Organic Search” session source.
What to look for: pages with high sessions but low engagement rate. These pages rank well but fail to satisfy visitors. The content may be thin, the headline may mislead, or the page may load too slowly. Conversely, pages with low sessions but high engagement rate are underpromoted. They deserve more internal links and backlink outreach.
Engagement rate benchmarks vary by industry. SaaS sites average 55-65%. E-commerce averages 45-55%. B2B lead generation averages 60-70%. A page 10 percentage points below your site average needs revision.
Action step: Identify your top 20 organic landing pages by session volume. For any page with engagement rate below your site average, audit the content against the top three ranking pages for the primary keyword.
Report 4: Query Analysis (Google Search Console)
The Queries report in GSC reveals what your audience is actually searching for. Many of these queries never appear in your keyword research tools because they are long-tail, brand-new, or highly specific. Work through to Performance, Search Results, then Queries.
What to look for: queries you rank for that are not targeted by any page on your site. These are content gaps. If you rank at position 12 for a query with 1,000 monthly searches and have no dedicated page for it, create one. You already have some authority for that term.
Also look for branded versus non-branded query splits. A healthy SEO program drives at least 60% of organic traffic from non-branded queries. If branded queries dominate, your SEO is not expanding your audience. It is just capturing existing demand.
Action step: Export all queries where your site ranks between positions 8 and 20 and impressions exceed 100 per month. These are your fastest wins. Create or optimize pages to target them.
Report 5: Conversion Attribution (GA4)
Traffic without conversions is a vanity metric. The conversion attribution report connects organic traffic to business outcomes. In GA4, go to Reports, Engagement, then Conversions. Filter by “Organic Search” and select your key events.
What to look for: organic conversion rate and how it compares to other channels. Organic leads should convert to qualified opportunities at 1.2-1.5 times the rate of paid search leads. If organic converts below paid, your content is attracting the wrong audience or your landing pages are failing to persuade.
Also examine assisted conversions. Organic search often initiates journeys that convert through other channels. GA4’s attribution models show this. Last-click attribution undervalues SEO by 2-3 times in most businesses.
Organic conversion rate benchmarks: SaaS 2-5%, e-commerce 1.5-3%, B2B lead generation 3-7%.
Action step: Calculate your organic cost per acquisition by dividing total SEO investment by organic conversions. Compare this to paid search CPA. Organic CPA should be 40-70% of paid CPA once the channel is mature.
Report 6: Core Web Vitals (Google Search Console)
Page experience is a confirmed ranking factor. The Core Web Vitals report in GSC shows how your pages perform on three metrics: Largest Contentful Paint (LCP), Interaction to Next Paint (INP), and Cumulative Layout Shift (CLS). Work through to Experience, then Core Web Vitals.
What to look for: the percentage of URLs rated “Good” on mobile. Google uses mobile scores for ranking. Seventy-five percent or more of your URLs should rate “Good” on all three metrics. Below 75% means page experience is hurting your rankings.
The thresholds are strict. LCP must be 2.5 seconds or less. INP must be 200ms or less. CLS must be 0.1 or less. Fifty-three percent of all websites fail all three metrics simultaneously.
INP deserves special attention in 2026. Sites with INP above 500ms saw position drops of 2-4 places during the March 2026 core update. Mobile INP scores are typically 60-80% worse than desktop.
Action step: Identify your highest-traffic pages that fail any Core Web Vital. Fix them in order of traffic volume. A page with 10,000 monthly sessions and poor LCP is a higher priority than a page with 100 sessions and poor CLS.
Report 7: Index Coverage (Google Search Console)
If Google cannot index your pages, they cannot rank. The Index Coverage report shows which pages are indexed, which are excluded, and why. Work through to Index, then Pages.
What to look for: the ratio of indexed pages to submitted pages. This should exceed 85%. Below that signals crawl budget problems, duplicate content issues, or technical barriers like noindex tags or robots.txt blocks.
Pay attention to the “Excluded” section. Common reasons include “Duplicate without user-selected canonical,” “Crawled currently not indexed,” and “Discovered currently not indexed.” Each requires a different fix. “Crawled currently not indexed” often means Google found your page but judged it low quality. “Discovered currently not indexed” means Google knows the page exists but has not crawled it yet, usually due to crawl budget constraints.
Action step: Review excluded pages monthly. For “Crawled currently not indexed” pages, improve content quality or consolidate thin pages. For “Discovered currently not indexed” pages on large sites, improve internal linking and XML sitemap priority.
Report 8: Backlink Profile (Ahrefs)
Backlinks remain one of the strongest ranking signals. The backlink profile report in Ahrefs shows who links to you, which pages earn links, and how your profile compares to competitors. Work through to Site Explorer, then Backlinks.
What to look for: referring domain growth rate and the quality distribution of those domains. A healthy profile adds 5-15 new referring domains per month for an active site. The majority should come from domains with a Domain Rating of 30 or higher.
Also examine your anchor text distribution. Over-optimized anchor text, where exact-match keywords dominate, is a spam signal. A natural profile has 40-50% branded anchors, 20-30% naked URLs, and 10-15% exact-match keywords.
Toxic links are less of a concern than they used to be. Google’s algorithm is better at ignoring low-quality links rather than penalizing for them. Focus on earning quality links rather than disavowing bad ones.
Action step: Compare your referring domain count to your top three competitors. If they have 50% more domains, you have an authority gap. Identify their most-linked content and create superior versions.
Report 9: Competitor Visibility (Ahrefs or Semrush)
SEO is relative. Your rankings depend on what you do AND what competitors do. The competitor visibility report tracks your share of voice against rivals. In Ahrefs, use the “Compare” feature in Site Explorer. In Semrush, use the Position Tracking “Visibility” tab.
What to look for: visibility trends over 90 days. If a competitor’s visibility surges while yours is flat, they are doing something you are not. Study their new content, backlink acquisitions, and technical improvements.
Visibility score is calculated from keyword positions and search volume. A score of 100 means you rank first for every tracked keyword. Most sites track scores between 5 and 30. What matters is the trend, not the absolute number.
Action step: Set up automated weekly visibility alerts for your top three competitors. Any jump of 10% or more triggers a competitive analysis. Check what content they published or what links they earned.
Report 10: Content Gap Analysis (Ahrefs)
The content gap report reveals keywords your competitors rank for that you do not. In Ahrefs, go to Site Explorer, enter a competitor URL, then Content Gap. Add your domain to the “But the following target does not rank for” field.
What to look for: high-volume keywords where multiple competitors rank but you do not. These are proven opportunities. If three competitors rank for a keyword with 5,000 monthly searches and you have no page for it, that is a clear content gap.
Also look for keywords where competitors rank in positions 1-3 and you rank in positions 8-10. These are not content gaps. They are optimization gaps. Your page exists but is not strong enough to compete.
Action step: Export the top 50 content gaps by volume. Prioritize keywords where at least two competitors rank in the top 10. Create dedicated pages for the highest-priority gaps.
Report 11: Internal Link Structure (Screaming Frog)
Internal links distribute authority across your site and help Google discover content. The internal link report in Screaming Frog shows which pages receive the most internal links, which have none, and where opportunities exist. Crawl your site, then export the “Inlinks” data.
What to look for: orphan pages. These are pages with zero internal links. Google may never find them. Also look for pages with excessive internal links. A page linked from every other page dilutes the value of each link.
The ideal structure is a hub-and-spoke model. Pillar pages receive links from many related cluster pages. Cluster pages link back to the pillar and to each other. This concentrates authority on your most important pages while distributing it to supporting content.
Action step: Identify your top 20 most-linked pages and your top 20 orphan pages. Add internal links from high-authority pages to orphan pages where topically relevant. Ensure every new article links to at least two existing articles.
Report 12: Page Speed Analysis (PageSpeed Insights)
Speed affects rankings and conversions. The PageSpeed Insights report gives specific, actionable recommendations for each page. Go to PageSpeed Insights, enter a URL, and review the Opportunities section.
What to look for: the specific opportunities listed, not just the score. A page scoring 75 might have one easy fix that pushes it to 90. Common high-impact fixes include image optimization, eliminating render-blocking resources, and reducing unused JavaScript.
Mobile scores matter more than desktop. Google uses mobile-first indexing. A page that scores 95 on desktop but 45 on mobile has a mobile problem that affects rankings.
The business impact is direct. Every second of load time delay reduces conversions by 7%. At 2 seconds, bounce rate is 9%. At 5 seconds, it jumps to 38%.
Action step: Test your top 20 landing pages. For any page scoring below 75 on mobile, implement the top three Opportunities listed. Retest after each change.
Report 13: Mobile Usability (Google Search Console)
Mobile usability issues block rankings on mobile devices, which is where most searches happen. The Mobile Usability report in GSC shows pages with problems like text too small, clickable elements too close, or content wider than the screen. Work through to Experience, then Mobile Usability.
What to look for: any page flagged with an error. Even a single mobile usability error can prevent a page from ranking well on mobile. Google may drop it from mobile results entirely.
Common errors include “Text too small to read,” “Clickable elements too close together,” “Content wider than screen,” and “Viewport not set.” Most are fixable with responsive design adjustments.
Action step: Review the Mobile Usability report weekly. Fix any new errors within 48 hours. Test fixes using Google’s Mobile-Friendly Test tool.
Report 14: SERP Feature Tracking (Semrush)
SERP features like featured snippets, People Also Ask boxes, and video carousels capture clicks that would otherwise go to standard results. The SERP Feature report in Semrush shows which features appear for your tracked keywords and whether you own them.
What to look for: keywords where a featured snippet exists but you do not own it. These are often easy wins. Featured snippets typically pull from pages ranking in positions 2-5. A small content optimization, like adding a concise definition or a numbered list, can capture the snippet.
Also track People Also Ask appearances. PAA boxes appear for 48% of all searches. Owning a PAA answer drives traffic and builds topical authority. The best PAA answers are 40-60 words, directly answer the question, and use the question as a heading.
Action step: Identify your top 20 keywords with featured snippets you do not own. Add a 40-60 word standalone answer block near the top of each page. Format it as a paragraph for definition snippets or a list for process snippets.
Report 15: AI Visibility Report (Custom / Profound)
AI search is no longer theoretical. Gartner projects 25% of search volume will migrate to AI chatbots by the end of 2026. The AI Visibility report tracks how often AI systems like ChatGPT, Claude, Perplexity, and Gemini cite your brand or content.
What to look for: AI mention rate and AI share of voice. AI mention rate is the percentage of tracked prompts that cite your brand. Fifteen percent or higher indicates strong brand presence in AI responses. AI share of voice compares your mentions to competitors. Category leaders typically hold 35-50%.
Tools like Profound, Peec, and custom monitoring scripts can track this. The methodology is simple: run a set of standardized prompts related to your industry, record which brands and URLs are cited, and track changes over time.
Action step: Define 20 prompts relevant to your industry. Run them monthly across ChatGPT, Claude, and Perplexity. Track which prompts cite your brand and which cite competitors. Optimize content on pages that are not cited.
Report 16: Brand Mention Monitoring (Ahrefs or Brand24)
Unlinked brand mentions are link building opportunities. The brand mention report tracks where your brand is mentioned online without a link. In Ahrefs, use Content Explorer to search for your brand name minus your domain. In Brand24, set up a mention alert.
What to look for: high-authority sites that mention your brand but do not link. These are warm outreach targets. The site already knows you exist and found you relevant enough to mention. A polite email requesting a link has a high success rate.
Also track sentiment. A surge in negative mentions may indicate a reputation issue that affects click-through rates even if rankings stay stable.
Action step: Set up weekly brand mention alerts. For any mention on a site with Domain Rating above 40, send a personalized outreach email within one week. Keep the email under 100 words and focus on the value to their readers.
Report 17: ROI and Cost Analysis (GA4 + Spreadsheet)
The final report ties everything together. SEO ROI measures whether your investment in content, tools, and personnel generates profitable returns. Build this report in a spreadsheet using data from GA4, your accounting system, and your SEO tools.
What to look for: organic revenue growth versus SEO spend. A mature SEO program should generate 3-5 times its cost in attributable revenue. Early-stage programs may show lower returns as they build authority.
Track these inputs: total SEO spend including tools, content creation, and personnel time; organic revenue from GA4; organic conversions by type; and assisted conversion value from multi-touch attribution.
The formula is simple: SEO ROI equals organic revenue minus SEO spend, divided by SEO spend, expressed as a percentage. An ROI of 300% means every dollar spent on SEO returns three dollars in revenue.
Action step: Build a monthly SEO ROI dashboard. Include organic revenue, SEO spend, ROI percentage, and year-over-year growth. Present it to leadership quarterly. If ROI drops below 200% for two consecutive quarters, audit your strategy.
How to Build Your SEO Reporting Dashboard
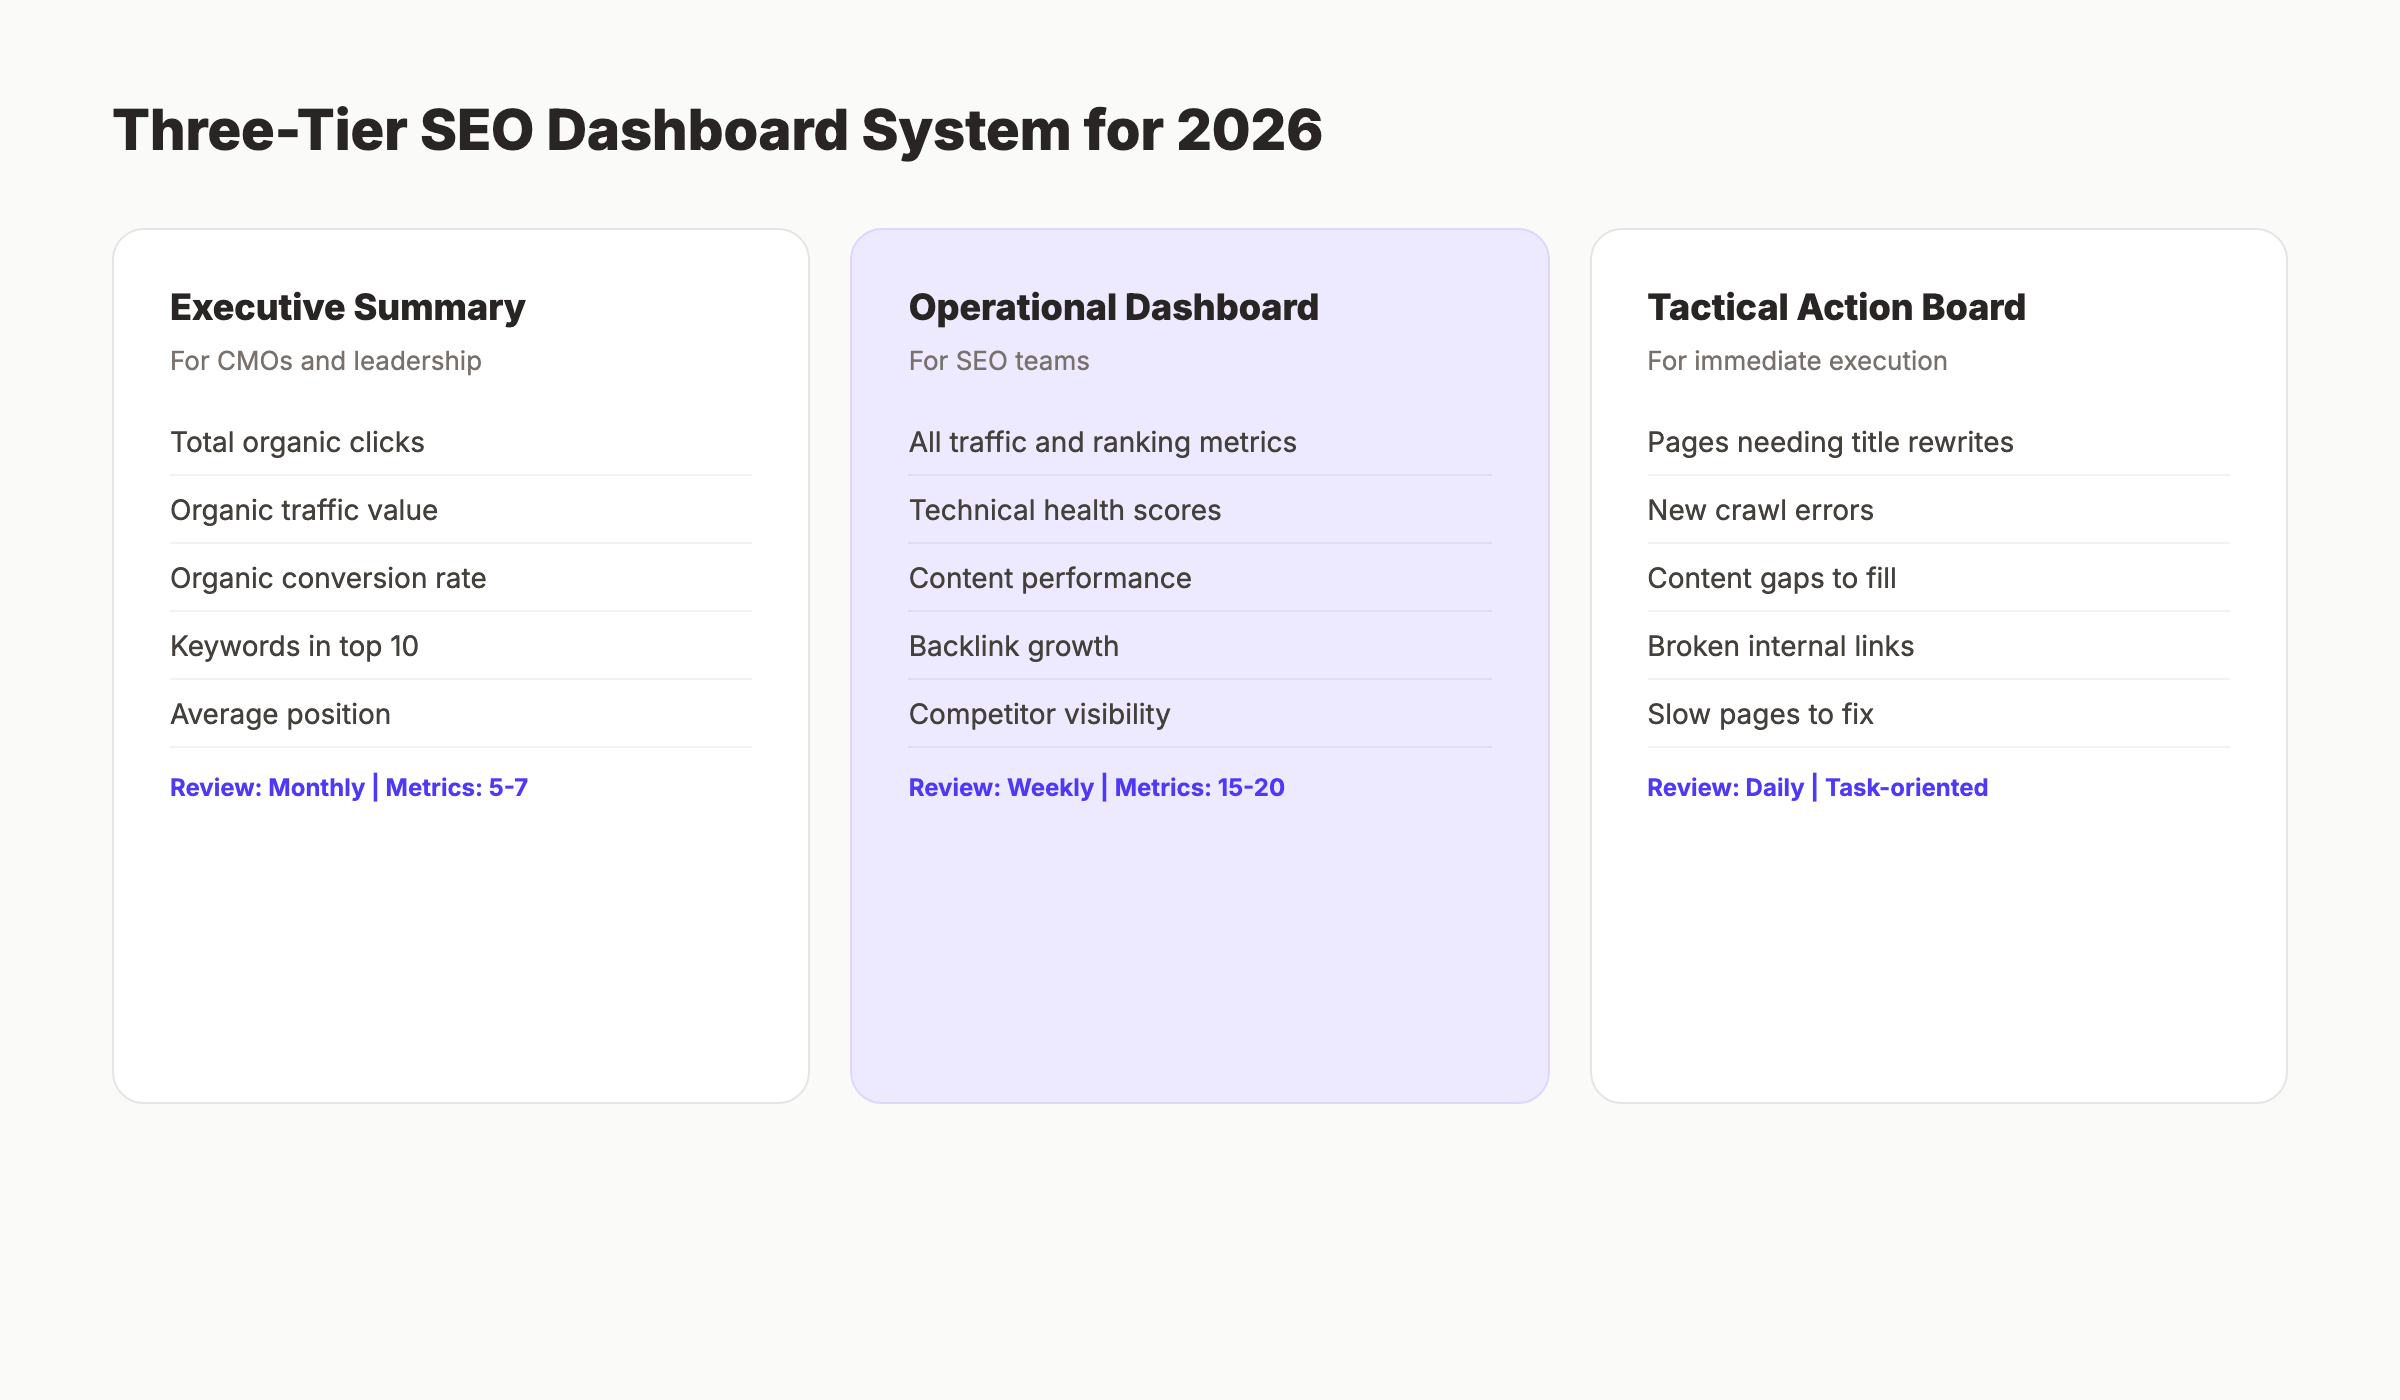
With 17 reports, the risk is overload. The fix is a tiered dashboard system. Leading SEO teams in 2026 use three purpose-built views rather than one overloaded dashboard.
Executive Summary Dashboard: 5-7 KPIs refreshed monthly. Include total organic clicks, estimated organic traffic value, organic conversion rate, keywords in top 10, and average position. This is what leadership sees.
Operational SEO Dashboard: 15-20 metrics refreshed weekly. Include all traffic, ranking, and technical metrics. This is what the SEO team uses daily.
Tactical Action Dashboard: Task-oriented, refreshed daily. Include pages needing title tag rewrites, new crawl errors, and content gaps to fill. This drives immediate action.
Research from Incremys in 2026 found that dashboards with fewer than 12 primary metrics drove 3 times more optimization actions than those displaying 30 or more metrics. The reason is focus. When everything is highlighted, nothing is highlighted.
Frequently Asked Questions
How often should I review SEO reports?
Review traffic and ranking reports weekly. Review technical reports monthly. Review competitive and content gap reports quarterly. Review ROI reports monthly for operational teams and quarterly for leadership. The key is matching review frequency to how quickly each metric changes. Rankings shift daily. Backlinks grow monthly. Content gaps emerge quarterly.
What is the most important SEO report for beginners?
Start with Google Search Console Performance. It is free, directly from Google, and shows the two metrics that matter most: what you rank for and how many clicks you get. Every other report builds on this foundation. If you only have time for one report, make it GSC Performance reviewed weekly.
Should I use GA4 or Universal Analytics for SEO reporting?
Use GA4. Universal Analytics stopped processing data in July 2023. GA4 is the only option for new data. Key differences for SEO: GA4 uses “engagement rate” instead of “bounce rate,” focuses on events rather than sessions, and offers predictive metrics like purchase probability. The learning curve is worth the advanced capabilities.
How do I track AI search visibility in 2026?
Track AI visibility by running standardized prompts across ChatGPT, Claude, Perplexity, and Gemini. Record which brands and URLs are cited. Calculate your AI mention rate and AI share of voice. Tools like Profound and Peec automate this. Alternatively, run 20 prompts manually each month and track results in a spreadsheet.
What is a good organic conversion rate?
Benchmarks vary by industry. SaaS sites average 2-5%. E-commerce averages 1.5-3%. B2B lead generation averages 3-7%. Compare your rate to your own historical performance rather than industry averages. A conversion rate of 2% that improves to 3% is more meaningful than hitting an arbitrary benchmark.
How many metrics should my SEO dashboard display?
Display fewer than 12 primary metrics on any single dashboard. Research from 2026 shows dashboards with 12 or fewer metrics drive 3 times more optimization actions than overloaded ones. Use multiple dashboards for different audiences: 5-7 KPIs for executives, 15-20 for operational teams, and task lists for tactical execution.
What SEO report shows the best return on investment?
The conversion attribution report in GA4 shows which organic traffic drives revenue. Combined with cost data in a spreadsheet, this becomes your ROI report. SEO ROI should be 3-5 times spend for mature programs. If you cannot connect SEO to revenue, focus on micro-conversions like email signups, demo requests, or content downloads as interim measures.
Conclusion
The 17 SEO data reports in this guide cover every dimension of search performance: traffic, rankings, conversions, technical health, competitive position, and emerging AI visibility. No team needs all 17 every day. But every team needs the right report at the right time.
Start with the fundamentals. Review GSC Performance and GA4 Organic Traffic weekly. Add technical reports monthly. Build competitive and gap analysis into your quarterly planning. And do not ignore AI visibility. By the end of 2026, 25% of search volume may flow through AI chatbots. The teams that track this now will adapt faster than those that wait.
The difference between good SEO teams and great ones is not the tools they use. It is the discipline to review the right data, extract insight, and act on it consistently. These 17 reports give you the data. The action is up to you.
Get all 17 reports in one place with Stacc. Our platform connects GSC, GA4, and ranking data into a unified dashboard. Track what matters, ignore what does not, and turn data into rankings. Start your free SEO audit
Related Tools & Resources
Free SEO Tools:
Best Lists:

Written by
Siddharth GangalSiddharth is the founder of theStacc and Arka360, and a graduate of IIT Mandi. He spent years watching great businesses lose organic traffic to competitors who simply published more. So he built a system to fix that. He writes about SEO, content at scale, and the tactics that actually move rankings.
30 SEO blog articles published every month
Keyword-optimized, scheduled, and live on your site. Automatically.
30-day trial · Cancel anytime
theStacc
Stop writing SEO content manually
30 blog articles, 30 GBP posts, and social media content. Published every month. Automatically.
Try for free$1 for 3 days · Cancel anytime